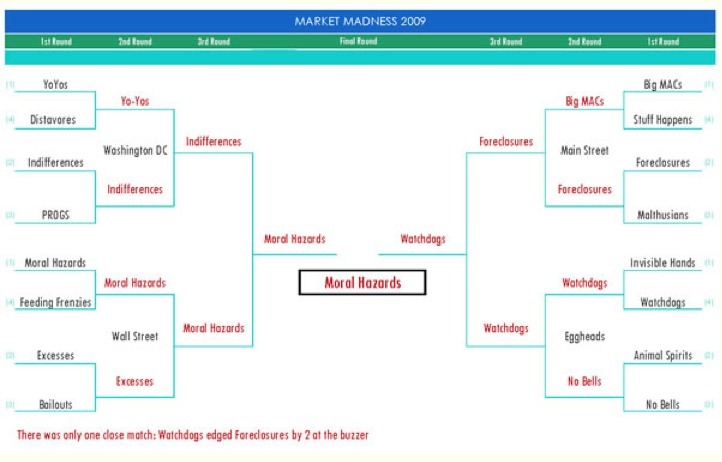
Chart of the Day – David Warsh at Economic Principals borrows a Market Madness chart from the University of Chicago’s Allen Sanderson to show where economists figure the economy went wrong.
Warsh explains:
Adopting as a metaphor the annual NCAA basketball tournament, he came up with sixteen competitive factors judged to have contributed to the global financial crisis and matched them up as in the graphic [above]. A few months later the American Economic Association printed the brackets in the program of its annual meeting and invited members to vote for their regional favorites and for a national champion.
For a description of the various teams, and a sense why voters concluded that the Hazards edged the Watchdogs in the tournament final, click [here]. The game may not yield much real information, but it’s a good exercise, a fine example of economists at play.
